
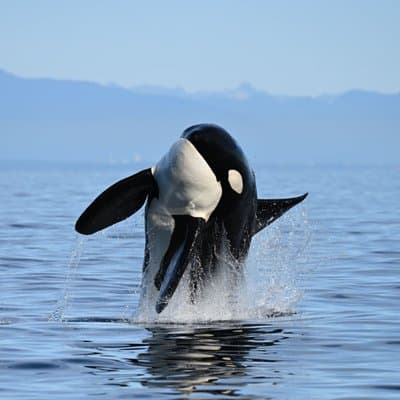
Vancouver Half-Day Whale Watching Adventure with Free Photos
4.95,722 reviews5h
from €166
Check availability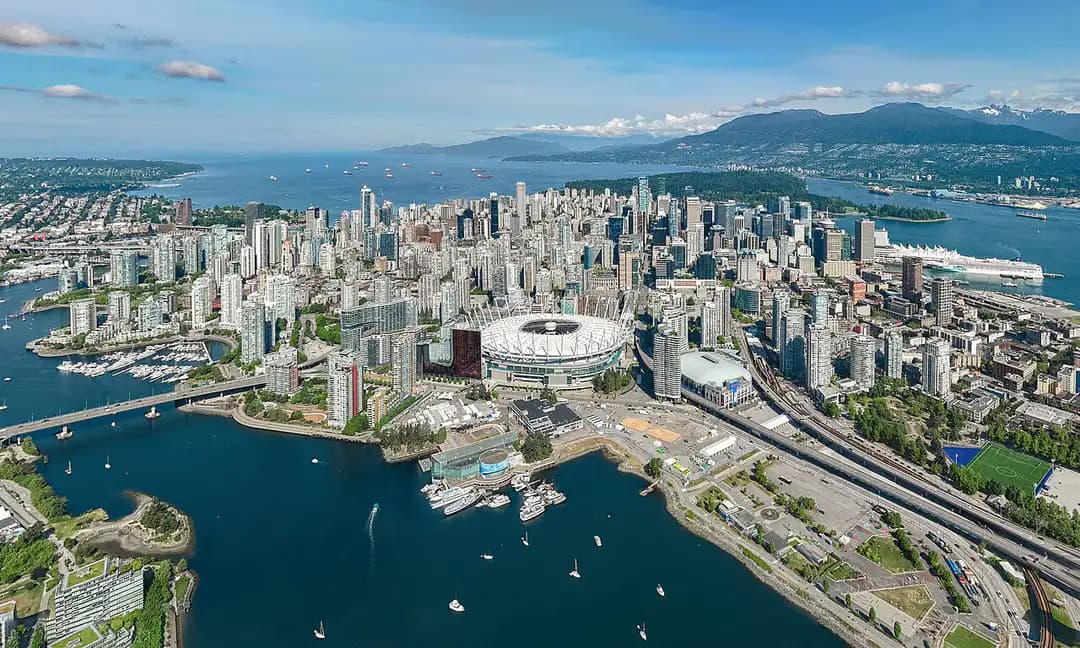
Vancouver, Canada
Weather month by month, from 20 years of weather-station records.
Average daily high and low, total rainfall and days with at least 2.5 mm of rain.
| Month | High / low | Rain | Verdict |
|---|---|---|---|
| January | 7°C / 3°C | 219 mm · 14 days | Cold |
| February | 8°C / 3°C | 125 mm · 11 days | Cold |
| March | 10°C / 5°C | 168 mm · 14 days | Cold |
| April | 14°C / 7°C | 111 mm · 10 days | Wet |
| May | 18°C / 10°C | 68 mm · 6 days | Fair |
| June | 20°C / 13°C | 55 mm · 5 days | Great |
| July | 24°C / 15°C | 27 mm · 2 days | Great |
| August | 23°C / 15°C | 41 mm · 3 days | Great |
| September | 20°C / 12°C | 95 mm · 7 days | Fair |
| October | 14°C / 9°C | 165 mm · 12 days | Wet |
| November | 10°C / 5°C | 242 mm · 16 days | Cold |
| December | 7°C / 3°C | 214 mm · 15 days | Cold |
In January, Vancouver averages highs of 7°C and lows of 3°C, with about 14 rainy days and 219 mm of rain. It is cold, so pack warm layers.
In February, Vancouver averages highs of 8°C and lows of 3°C, with about 11 rainy days and 125 mm of rain. It is cold, so pack warm layers.
In March, Vancouver averages highs of 10°C and lows of 5°C, with about 14 rainy days and 168 mm of rain. It is cold, so pack warm layers.
In April, Vancouver averages highs of 14°C and lows of 7°C, with about 10 rainy days and 111 mm of rain. It is one of the wetter months, so keep indoor plans in reserve.
In May, Vancouver averages highs of 18°C and lows of 10°C, with about 6 rainy days and 68 mm of rain. Expect mixed weather, with comfortable spells.
In June, Vancouver averages highs of 20°C and lows of 13°C, with about 5 rainy days and 55 mm of rain. It is one of the most comfortable months for sightseeing.
In July, Vancouver averages highs of 24°C and lows of 15°C, with about 2 rainy days and 27 mm of rain. It is one of the most comfortable months for sightseeing.
In August, Vancouver averages highs of 23°C and lows of 15°C, with about 3 rainy days and 41 mm of rain. It is one of the most comfortable months for sightseeing.
In September, Vancouver averages highs of 20°C and lows of 12°C, with about 7 rainy days and 95 mm of rain. Expect mixed weather, with comfortable spells.
In October, Vancouver averages highs of 14°C and lows of 9°C, with about 12 rainy days and 165 mm of rain. It is one of the wetter months, so keep indoor plans in reserve.
In November, Vancouver averages highs of 10°C and lows of 5°C, with about 16 rainy days and 242 mm of rain. It is cold, so pack warm layers.
In December, Vancouver averages highs of 7°C and lows of 3°C, with about 15 rainy days and 214 mm of rain. It is cold, so pack warm layers.
The tours and tickets travellers book most, with ratings and reviews from Viator.
from €166
Check availability
from €166
Check availability

Tours and prices from Viator, a Tripadvisor company. Prices change with your dates. We may earn a commission if you book, at no extra cost to you.
June is the most comfortable month on average, with highs of 20°C. July and August are close behind.
November is the wettest month, with about 242 mm of rain.
July is the warmest month, with average highs of 24°C and lows of 15°C. The coldest nights come in February, averaging 3°C.
Averages for 2006–2025 from the VANCOUVER HARBOUR CS weather station (1 km from the centre), NOAA Global Historical Climatology Network. Verdicts rate sightseeing comfort from daytime highs and rainy days.