
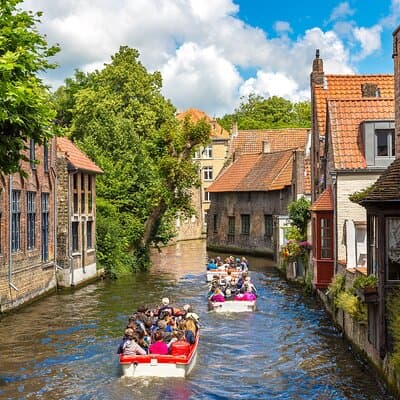
Bruges and Ghent - Belgium's Fairytale Cities - from Brussels
4.25,068 reviews10h 30m
from €45
Check availability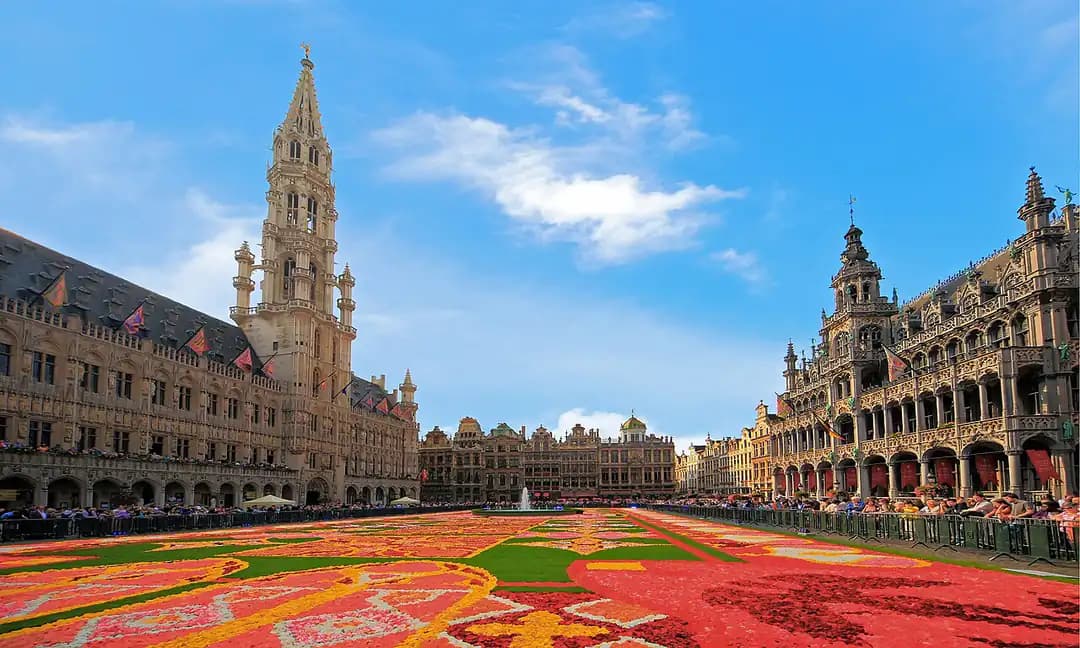
Brussels, Belgium
Weather month by month, from 20 years of weather-station records.
Average daily high and low, total rainfall and days with at least 2.5 mm of rain.
| Month | High / low | Rain | Verdict |
|---|---|---|---|
| January | 6°C / 1°C | 86 mm · 11 days | Cold |
| February | 8°C / 2°C | 71 mm · 10 days | Cold |
| March | 12°C / 4°C | 71 mm · 8 days | Cold |
| April | 16°C / 6°C | 47 mm · 6 days | Fair |
| May | 19°C / 9°C | 72 mm · 8 days | Fair |
| June | 22°C / 13°C | 89 mm · 8 days | Great |
| July | 24°C / 14°C | 87 mm · 7 days | Great |
| August | 23°C / 14°C | 103 mm · 9 days | Great |
| September | 21°C / 12°C | 69 mm · 7 days | Great |
| October | 16°C / 9°C | 84 mm · 9 days | Fair |
| November | 11°C / 5°C | 75 mm · 10 days | Cold |
| December | 7°C / 3°C | 100 mm · 11 days | Cold |
Spring sees the city awaken with blooming flowers in the parks and milder temperatures. The famous Royal Greenhouses of Laeken usually open to the public for a few weeks in April/May.
Warm, long days with average highs around 22°C (72°F). The city is vibrant with outdoor festivals, terrace cafes, and events like the Ommegang historical pageant and the biennial Flower Carpet in the Grand Place (even-numbered years).
Crisp air and beautiful fall foliage in parks like the Bois de la Cambre. The cultural season is in full swing, and the beer scene feels particularly cozy as the weather cools.
Cold and often gray, with temperatures around 5°C (41°F). The city transforms with Christmas markets, most notably the Winter Wonders event with an ice rink, light show, and market stalls around the Grand Place.
In January, Brussels averages highs of 6°C and lows of 1°C, with about 11 rainy days and 86 mm of rain. It is cold, so pack warm layers.
In February, Brussels averages highs of 8°C and lows of 2°C, with about 10 rainy days and 71 mm of rain. It is cold, so pack warm layers.
In March, Brussels averages highs of 12°C and lows of 4°C, with about 8 rainy days and 71 mm of rain. It is cold, so pack warm layers.
In April, Brussels averages highs of 16°C and lows of 6°C, with about 6 rainy days and 47 mm of rain. Expect mixed weather, with comfortable spells.
In May, Brussels averages highs of 19°C and lows of 9°C, with about 8 rainy days and 72 mm of rain. Expect mixed weather, with comfortable spells.
In June, Brussels averages highs of 22°C and lows of 13°C, with about 8 rainy days and 89 mm of rain. It is one of the most comfortable months for sightseeing.
In July, Brussels averages highs of 24°C and lows of 14°C, with about 7 rainy days and 87 mm of rain. It is one of the most comfortable months for sightseeing.
In August, Brussels averages highs of 23°C and lows of 14°C, with about 9 rainy days and 103 mm of rain. It is one of the most comfortable months for sightseeing.
In September, Brussels averages highs of 21°C and lows of 12°C, with about 7 rainy days and 69 mm of rain. It is one of the most comfortable months for sightseeing.
In October, Brussels averages highs of 16°C and lows of 9°C, with about 9 rainy days and 84 mm of rain. Expect mixed weather, with comfortable spells.
In November, Brussels averages highs of 11°C and lows of 5°C, with about 10 rainy days and 75 mm of rain. It is cold, so pack warm layers.
In December, Brussels averages highs of 7°C and lows of 3°C, with about 11 rainy days and 100 mm of rain. It is cold, so pack warm layers.
The tours and tickets travellers book most, with ratings and reviews from Viator.
from €45
Check availability
from €99
Check availability
from €35
Check availability
Tours and prices from Viator, a Tripadvisor company. Prices change with your dates. We may earn a commission if you book, at no extra cost to you.
June is the most comfortable month on average, with highs of 22°C. July and August are close behind.
August is the wettest month, with about 103 mm of rain.
July is the warmest month, with average highs of 24°C and lows of 14°C. The coldest nights come in January, averaging 1°C.
Averages for 2006–2025 from the UCCLE weather station (6 km from the centre), NOAA Global Historical Climatology Network. Verdicts rate sightseeing comfort from daytime highs and rainy days.