

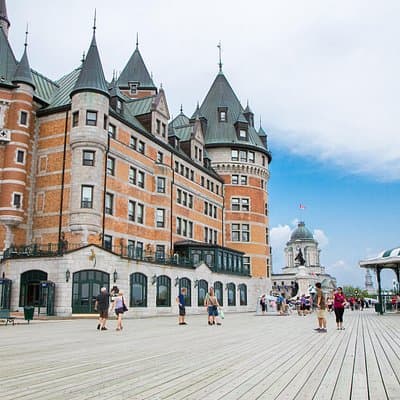
Best months
July, August, and September
Warmest month
July, 26°C
Wettest month
June, 127 mm
Quebec City weather by month
Average daily high and low, total rainfall and days with at least 2.5 mm of rain.
| Month | High / low | Rain | Verdict |
|---|---|---|---|
| January | -5°C / -13°C | 75 mm · 8 days | Cold |
| February | -4°C / -12°C | 77 mm · 7 days | Cold |
| March | 2°C / -6°C | 86 mm · 7 days | Cold |
| April | 9°C / 1°C | 88 mm · 8 days | Cold |
| May | 17°C / 8°C | 96 mm · 8 days | Fair |
| June | 22°C / 13°C | 127 mm · 10 days | Good |
| July | 26°C / 16°C | 120 mm · 9 days | Great |
| August | 25°C / 15°C | 117 mm · 8 days | Great |
| September | 20°C / 11°C | 101 mm · 7 days | Great |
| October | 13°C / 5°C | 117 mm · 9 days | Fair |
| November | 5°C / -1°C | 96 mm · 9 days | Cold |
| December | -2°C / -9°C | 109 mm · 11 days | Cold |
Quebec City by season
Spring
Spring (April-May) is a transitional period known as 'la saison des sucres' (maple syrup season). Snow melts, revealing muddy ground ('le dégel'), and days gradually warm. It's the quietest tourist season.
- + Fewer crowds and lower hotel rates
- + Maple syrup festivals at nearby sugar shacks
- + Comfortable temperatures for walking by late May
- − Unpredictable weather: rain, slush, and lingering chill
- − Some attractions may have limited hours pre-summer
Summer
Summer (June-August) is peak season, with long, sunny days averaging 25°C (77°F). The city is lush, vibrant, and bursting with festivals, outdoor patios, and street performers.
- + Ideal weather for exploring on foot
- + Major festivals like Festival d'été de Québec
- + All attractions, tours, and parks are fully operational
- − Highest prices for flights and hotels
- − Significant crowds, especially in Old Quebec
Autumn
Autumn (September-October) is spectacular, with crisp air and brilliant fall foliage painting the city and surrounding countryside in reds and golds. A favorite for photographers.
- + Stunning fall colors, especially on the Plains of Abraham
- + Pleasant, cooler temperatures perfect for hiking
- + Summer crowds have dissipated
- − Weather becomes increasingly unpredictable and cooler
- − Some summer-specific activities (e.g., certain tours) end by October
Winter
Winter (December-February) is cold (-12°C/10°F average) and snowy, transforming the city into a magical, festive wonderland, especially during the Quebec Winter Carnival.
- + Magical Christmas markets and decorations in December
- + The world-famous Quebec Winter Carnival (late Jan-early Feb)
- + Unique winter activities: ice skating, dog sledding, snowshoeing
- − Extremely cold temperatures require serious winter clothing
- − Some outdoor attractions may be closed or limited
Quebec City month by month
Quebec City in January
ColdIn January, Quebec City averages highs of -5°C and lows of -13°C, with about 8 rainy days and 75 mm of rain. It is cold, so pack warm layers.
Quebec City in February
ColdIn February, Quebec City averages highs of -4°C and lows of -12°C, with about 7 rainy days and 77 mm of rain. It is cold, so pack warm layers.
Quebec City in March
ColdIn March, Quebec City averages highs of 2°C and lows of -6°C, with about 7 rainy days and 86 mm of rain. It is cold, so pack warm layers.
Quebec City in April
ColdIn April, Quebec City averages highs of 9°C and lows of 1°C, with about 8 rainy days and 88 mm of rain. It is cold, so pack warm layers.
Quebec City in May
FairIn May, Quebec City averages highs of 17°C and lows of 8°C, with about 8 rainy days and 96 mm of rain. Expect mixed weather, with comfortable spells.
Quebec City in June
GoodIn June, Quebec City averages highs of 22°C and lows of 13°C, with about 10 rainy days and 127 mm of rain. It is a good month to visit.
Quebec City in July
GreatIn July, Quebec City averages highs of 26°C and lows of 16°C, with about 9 rainy days and 120 mm of rain. It is one of the most comfortable months for sightseeing.
Quebec City in August
GreatIn August, Quebec City averages highs of 25°C and lows of 15°C, with about 8 rainy days and 117 mm of rain. It is one of the most comfortable months for sightseeing.
Quebec City in September
GreatIn September, Quebec City averages highs of 20°C and lows of 11°C, with about 7 rainy days and 101 mm of rain. It is one of the most comfortable months for sightseeing.
Quebec City in October
FairIn October, Quebec City averages highs of 13°C and lows of 5°C, with about 9 rainy days and 117 mm of rain. Expect mixed weather, with comfortable spells.
Quebec City in November
ColdIn November, Quebec City averages highs of 5°C and lows of -1°C, with about 9 rainy days and 96 mm of rain. It is cold, so pack warm layers.
Quebec City in December
ColdIn December, Quebec City averages highs of -2°C and lows of -9°C, with about 11 rainy days and 109 mm of rain. It is cold, so pack warm layers.
Top tours and experiences in Quebec City
The tours and tickets travellers book most, with ratings and reviews from Viator.
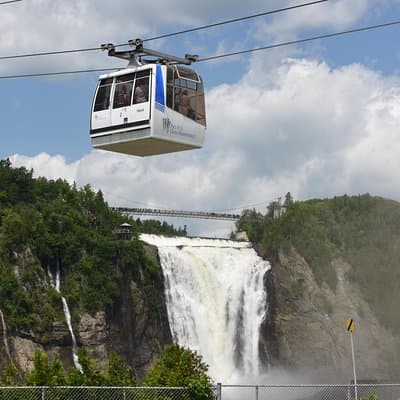
Half-Day Trip to Montmorency Falls and Ste-Anne-de-Beaupré from Quebec city
4.23,169 reviews5h 15m
from €65
Check availability
Old Quebec City Food Tour with 10+ Authentic Local Tastings
4.81,978 reviews3h
from €90
Check availability
All things to do in Quebec City →
Tours and prices from Viator, a Tripadvisor company. Prices change with your dates. We may earn a commission if you book, at no extra cost to you.
Plan your Quebec City trip
Best time to visit Quebec City: FAQ
What is the best month to visit Quebec City?+
July is the most comfortable month on average, with highs of 26°C. August and September are close behind.
What is the rainiest month in Quebec City?+
June is the wettest month, with about 127 mm of rain.
How hot does Quebec City get?+
July is the warmest month, with average highs of 26°C and lows of 16°C. The coldest nights come in January, averaging -13°C.
Averages for 2006–2025 from the BEAUPORT weather station (3 km from the centre), NOAA Global Historical Climatology Network. Verdicts rate sightseeing comfort from daytime highs and rainy days.